Advanced usage
NOP functions
There are scenarios where all we want is to NOP out some calls, be it because it will trigger an undesired execution or because we want to nullify some functionality. In this case, Frida offers us two ways to actually do this using the replace API or memory patching. In this example we will try to NOP KERNEL32.DLL’s CreateFileW.
Using the replace API
const CreateFileWPtr = Module.getExportByName("kernelbase.dll", "CreateFileW");
const emptyCallback = new NativeCallback((lpFileName, dwDesiredAccess, dwShareMode, lpSecurityAttributes, dwCreationDisposition, dwFlagsAndAttributes, hTemplateFile) {}, 'int', ['pointer', 'int', 'int', 'int', 'int', 'int', 'pointer'])
Interceptor.replace(CreateFileWPtr, emptyCallback);
First, we get a pointer to the CreateFileW function in the kernelbase.dll library. Next, we create a new function using the NativeCallback interface. The new function needs to have the same function signature as the function it will replace, which is indicated by the second argument (the return value) and third argument (an array of types). In this case, the new function body is empty, so the function doesn't do anything. Finally, we use Interceptor.replace(<target>, <replacement>) to make sure the new function is called instead of the original one.
Patching memory
Instead of changing the entire function implementation, it's also possible to only change individual instructions. Take for example the following program:
#include <stdio.h>
#include <stdlib.h>
#include <fcntl.h>

int main(int argc, char *argv[])
{
    int fd;
    fd = open("code.dat", O_RDONLY);
    if (fd == -1)
    {
        fprintf(stderr, "file not found\n");
    }

    return 0;
}
Memory.patchCode(openPtr, Process.pageSize, function (code)
  {
    const cw = new X86Writer(code, {pc: openPtr});
    cw.putNopPadding(Process.pageSize);
    cw.putRet();
    cw.flush();
  }
);
The Memory.patchCode API allows us to modify N bytes at X address which is given as a NativePointer, this pointer must be writable for us to modify it. In some systems such as iOS, the address pointer is written to a temporary location before being mapped into memory. For this reason, the first argument of your code writer should be the code parameter, rather than the openPtr).
Patching is platform and architecture dependent, so be sure to use the correct code generation writer (ARM, X86, AArch64, MIPS…) – For a full list of CPU code writers refer to: https://frida.re/docs/javascript-api/#x86writer
To NOP functions or code blocks, memory patching is the desired way of doing it, it generates less overhead for the target binary and is cleaner but if you are not sure just go with the .replace() approach.
Memory scanning
Frida allows scanning memory for patterns if we provide a memory range and the size we want to scan. The pattern must be a hex string separated by spaces.
For example, the string "Frida rocks!" translates as "46 52 49 44 41 20 72 6f 63 6b 73 21".
It is also possible to use wildcards using the ? character: "46 52 49 44 41 20 ?? ?? ?? ?? ?? 21"
This pattern will match any "Frida _____!" pattern found in memory and return it in a list.
Now, we will use our previous example that checks whether a file exists or not and we will ask it to search for a file named "Frida rocks!". We will use Memory.scanSync to find any pattern containing frida _____! in memory.
We first fire up our Frida REPL and get the information of the first module:
[Local::a.out]-> bin = Process.enumerateModulesSync()[0]
{
    "base": "0x10a87e000",
    "name": "a.out",
    "path": "/Users/fernandou/Desktop/a.out",
    "size": 16384
}
We now have the bin variable that stores the base address of the module, path, and size. Once we have this information, we can scan using the previous pattern string:
[Local::a.out]-> Memory.scanSync(bin.base, bin.size, "46 52 49 44 41 20 ?? ?? ?? ?? ?? 21")
[
    {
        "address": "0x102ae5fa0",
        "size": 12
    }
]
The scanSync API returns us a single match at the address 0x102ae5fa0 and the size of the match is 12 bytes. If we want to see what is at that address, we can do so by using hexdump:
[Local::a.out]-> console.log(hexdump(ptr(0x102ae5fa0)))
            0  1  2  3  4  5  6  7  8  9  A  B  C  D  E  F  0123456789ABCDEF
102ae5fa0  46 52 49 44 41 20 72 6f 63 6b 73 21 00 00 00 00  Frida rocks!....
102ae5fb0  01 00 00 00 1c 00 00 00 00 00 00 00 1c 00 00 00  ................
102ae5fc0  00 00 00 00 1c 00 00 00 02 00 00 00 60 3e 00 00  ............`>..
102ae5fd0  34 00 00 00 34 00 00 00 17 3f 00 00 00 00 00 00  4...4....?......
It is also possible to use partial wild cards instead of ??, you can use a single ? to pair it up: 46 2? 21.
Memory scanning: Reacting on memory patterns
One of the applications of the Memory.scan API is reacting whenever a match is found. This is a useful feature when the user wants to modify data on the fly. Unlike in the previous section where the API was used to identify the address that matched the pattern, this time we will modify the matched pattern to change the flow of the application.
To demonstrate the power of this feature, the following program will be used:
#include <stdio.h>
#include <time.h>
#include <unistd.h>

struct keyPress {
        int key_type;
        int timestamp;
        int scan_code;
        int virtual_scan_code;
};

void guess_pressed_key(struct keyPress* p)
{
        printf("key_type: %d scan_code: %d\n", p->key_type, p->scan_code);
        sleep(5);
        if(p->scan_code == 52)
        {
                printf("arrow up\n");
        }

        if(p->scan_code == 51)
        {
                printf("arrow right\n");
        }
}

int main()
{
        struct keyPress kp;
        kp.key_type = 301;
        kp.timestamp = (int)time(NULL);
        kp.scan_code = 52;
        kp.virtual_scan_code = 52;
        printf("%p\n", guess_pressed_key);
        guess_pressed_key(&kp);
        return 0;
}
The code takes a simple struct and prints "arrow up" or "arrow right" depending on the value of scan_code which is an int member of a struct. Our goal is to get the program to print "arrow right" by modifying its memory.
The struct is composed by four integers which means that in memory each member is offset by 4 bytes each. Although the timestamp member is always random, it is possible to guess each value when dumping the memory (using hexdump):
           0  1  2  3  4  5  6  7  8  9  A  B  C  D  E  F  0123456789ABCDEF
ff955100  2d 01 00 00 24 8a 46 62 34 00 00 00 34 00 00 00  -...$.Fb4...4...
ff955110  00 50 f9 f7 00 00 00 00 00 00 00 00 a1 5f dd f7  .P..........._..
2d 01 00 00 is the first member, 301. 24 8a 46 62 is the second member which is a timestamp and the remaining two members are 34 00 00 00, 34 00 00 00 meaning 52 each. Now that we have a clear idea of how this information is represented in Memory we can use the Memory.scan API to react whenever this pattern is seen in memory and modify it on the fly:
2d 01 00 00 ?? ?? ?? ?? 33 00 00 00 33 00 00 00
Where ?? is used to match any value, allowing us to get a match even if the timestamp is always changing. Now the Memory.scan API can be used match the pattern and replace it:
// get the latest rw- range.
const module = Process.enumerateRangesSync('rw-').pop();

Memory.scan(module.base, module.size, '2d 01 ?? ?? ?? ?? ?? ?? 34 ?? ?? ?? 34 ?? ?? 00',
    {
        onMatch(address, size) {
            console.log("Pattern matched @ " + address);

            address.writeByteArray([0x2d, 0x01, 0x00, 0x00, 0x00, 0x00, 0x00, 0x00, 0x33, 0x00, 0x00, 0x00, 0x33, 0x00, 0x00, 0x00]);
        }
    }
);
Whenever there is a match, the address is printed and then the method .writeByteArray is called on address to write the bytes that trigger "arrow right". When running this script in Frida it delivers the following output:
Spawned `a.out`. Resuming main thread!
key_type: 301 scan_code: 52
[Local::a.out ]-> Pattern matched @ 0xffb57990
arrow right
Process terminated
Using custom libraries (DLL/.so)
There might be scenarios where we want to load custom libraries into the target process. For example, the custom library may have interesting functions we can use in our own scripts, or maybe somebody already created a custom DLL which makes the required modifications that we want to do. For this use case, Frida offers the Module.load method.
Module.load allows us to load an external library into our instrumentation session. Once loaded, it behaves as a regular module in Frida, which means we can use the Module API methods (findExportByName, enumerateExports, enumerateImports... ).
To illustrate how this works, the following C program is used:
#include <stdio.h>
#include <stdlib.h>

int main() {
    FILE *fp;
    fp = fopen("file.txt", "w+");
    fprintf(fp, "%s %s", "May the force", "be with you");
    fclose(fp);
    return 0;
}
The purpose of this example is to replace the function fopen using a custom DLL instead of using Frida's Interceptor.replace.
Save the code as program.c and compile the code using clang:
$ clang -Wall program.c -o program
Creating a custom DLL
The first step is creating a custom DLL. If you know how this process works then you can skip this subsection.
The DLL will have a single function that envelopes fopen and prints the filepath argument. Let's create a libtest.c file that implements a my_fopen function:
#include <stdlib.h>
#include <stdio.h>

FILE *my_fopen(const char *filename, const char *mode) {
    printf("lib: %s\n", filename);
    return fopen(filename, mode);
}
We also need a separate libtest.h with the my_fopen declaration:
#include <stdlib.h>
#include <stdio.h>

FILE *my_fopen(const char *filename, const char *mode);
Once these files are created, then the only remaining task is using clang to create a shared library:
$ clang -shared -undefined dynamic_lookup -o libtest.so libtest.c
If everything went well, there should be a libtest.so shared library file in your current folder:
$ file libtest.o
libtest.o: ELF 64-bit LSB shared object, x86-64, version 1 (SYSV), dynamically linked, not stripped
Using our custom library
Once the custom library is created we can use Frida to dynamically load it into the target process. We can just use the normal frida REPL, but we will use the --pause argument to make sure we can perform all necessary actions before the main function is executed:
$ file -f program --pause
We will first load our custom library, then obtain a pointer to our custom function and then create a NativeFunction from this function so that it can be used from our code. The final step is replacing the original function with the custom one.
Once inside Frida's REPL, the first step is to load our custom library via Module.load:
[Local::a.out]-> myModule = Module.load('libtest.so')
{
    "base": "0x7f0cf409c000",
    "name": "libtest.so",
    "path": "/home/lazarus/libtest.so",
    "size": 20480
}
When Frida loads the module it returns a module object that is loaded into memory. We can use this object and perform typical Module operations on it, such as enumerating the exports:
[Local::a.out]-> myModule.enumerateExports()
[
    {
        "address": "0x7f0cf409d120",
        "name": "my_fopen",
        "type": "function"
    }
]
Our custom my_fopen function is loaded at the address 0x7f0cf409d120, which is the address that is needed when creating a NativeFunction objection:
my_fopen_ptr = myModule.enumerateExports()[0].address;
myfopen = new NativeFunction(my_fopen_ptr, 'pointer', ['pointer', 'pointer']);
The return value of my_fopen is a pointer to a FILE object, so it is set as pointer type and the arguments (filename and mode) are pointers to const char as well. Note that once the NativeFunction is created then it can be called from the instrumentation code as many times as desired. The final step is to call Interceptor.replace and call the custom function instead:
fopenPtr = Module.findExportByName(null, "fopen")
Interceptor.replace(fopenPtr, new NativeCallback((pathname, mode) => {
 return myfopen(pathname, mode);
}, 'pointer', ['pointer', 'pointer']))
Now that our replacement is in place, we can execute the %resume command to start the execution of the main function. From the output, we can see that the custom myfopen function is called instead of the regular fopen and the program will continue working as intended.
[Local::a.out]-> %resume
[Local::a.out]-> lib: file.txt
lib: /dev/urandom
The custom library function correctly prints the values of the first argument.
Reading and writing registers
Frida has code writers to write machine code directly to memory at a specific address for x86, x64, ARM and MIPS. We can use this to write instructions directly to memory at a given address as we have seen before when NOPing instructions.
In order to see how this works we have this easy program to play with:
#include <stdio.h>

int add(int a, int b) {
    return a + b;
}

void main()
{
    printf("result: %d", add(10, 20));
}
$ clang -Wall -o add add.c
This program simply calls the function add(int a, int b) and returns the sum of a and b.
Let's assume we're running on an ARM64 system. When this function is called, a is stored in the x0 register, and a is stored in the x1 register. We can quickly verify this by writing the following script:
const addPtr = Module.getExportByName(null, "add");

Interceptor.attach(addPtr, {
    onEnter (args) {
        console.log('x0:' + this.context.x0.toInt32());
        console.log('x1:' + this.context.x1.toInt32());
    }
});
Which returns after executing it with frida -l add.js -f add:
$ frida -l add.js -f add
Spawned `add`. Resuming main thread!
result: 30
x0:10
x1:20
[Local::a.out]-> Process terminated
Calling conventions
If we were executing this on another system, the calling convention might be different. For example, some architectures store arguments on the stack, and even others use a combination of stack and registers.
Although we could simply use args[0] and args[1] to modify the values, we will use the code writers instead. In this case, we need the Arm64Writer to modify the x0 register:
const addPtr = Module.getExportByName(null, "add");
Memory.patchCode(addPtr, Process.pointerSize, function (code) {
    const cw = new Arm64Writer(code, { pc: addPtr });
    cw.putLdrRegU64('x0', 1337);
    cw.putRet();
    cw.flush();
});
Using the LDR instruction, the number 1337 is saved into x0. After the LDR command we will put a RET instruction, which means the value of x0 is returned to the calling function.
Now, we can run the script:
$ frida -l add.js -f add
Spawned `add`. Resuming main thread!
result: 1337
Process terminated
As you can see we have easily modified the function in memory! For a complete list of methods available, refer to the Frida ARM64Writer documentation.
Reading structs
We are able to read function arguments with Frida using the args:NativePointer[] array. However, this is not possible with arguments that are not simple types such as structs.
Knowing how to handle structs is very important, as we will encounter them in many different places. For example, we can find structs in the Unix time libraries, or, more importantly, in Windows’s APICALLs such as the ones in NTDLL.
We will take a look at the following examples:
- Understanding and reading a user-controlled struct.
- Reading a UNIX syscall structure.
- Reading a Windows NTDLL structure.
Reading from a user-controlled struct
Given the following declaration:
void print_struct(myStruct s)
We want to log each different member of the struct stored in s. As we can see, the only thing that we have is s and we can’t apply any Frida API method such as .readInt() or .readCString(). We need to first gather the offsets of the struct to be sure what we are trying to read.
The myStruct struct is defined as follows:
struct myStruct
{
  short member_1;
  int member_2;
  int member_3;
  char *member_4;
} sample_struct;
In order to gather the offsets we need to know the sizes of each type:
{
  "short": 4,
  "int": 4,
  "pointer": Process.pointerSize,
  "char": 1,
  "long": Process.pointerSize,
  "longlong": 8,
  "ansi": Process.pointerSize,
  "utf8": Process.pointerSize,
  "utf16": Process.pointerSize,
  "string": Process.pointerSize,
  "float": 4,
};
So what we can see is that short has a size of 4, longlong a size of 8, char is 1 but then there’s Process.pointerSize for the ansi, string and pointer ones. The reason for this is that size of these types is dependent on the architecture we are running on. Since it's variable we need to take this information into account when accessing a struct.
It’s important to note that we can always read the first member without any major issues, because the offset of it is 0.
So, what are the offsets of the previous structure?
struct myStruct
{
  short member_1; // 0x0 (4 bytes)
  int member_2; // 0x4 (4 bytes)
  int member_3; // 0x8 (4 bytes)
  char *member_4; // 0x12 (8 bytes)
} sample_struct;
So now we have the offsets of the structure and we want to read each value. To obtain the correct offset, we will use the .add() operator. .add(offset), as the name says, adds an offset to a given NativePointer.
Therefore, we can place our pointer in the desired offset to read each value:
// Given s = args[0]:NativePointer
s.readShort() // 1st member.
s.add(4).readInt() // 2nd member.
s.add(8).readInt() // 3rd member.
s.add(12).readPointer().readCString(); // 4th member.
This way we will have obtained the values for each structure offset.
SYSCALL struct
For this example we will be using a known linux SYSCALL named gettimeofday. The MAN page for gettimeofday can be found at https://man7.org/linux/man-pages/man2/gettimeofday.2.html
We have the following declaration:
int gettimeofday(struct timeval *tv, struct timezone *tz);
From this we can quickly figure out that timeval and timezone are two structs. To figure out the offsets, we need to find the definition of both structs.
The timeval struct is:
  struct timeval {
    time_t      tv_sec;     /* seconds */
    suseconds_t tv_usec;    /* microseconds */
  };
Note: The time_t size is even dependent on the API level you are targeting in Android systems. Do not forget to get its size with Process.PointerSize()
The timezone struct is:
struct timezone {
    int tz_minuteswest;     /* minutes west of Greenwich */
    int tz_dsttime;         /* type of DST correction */
 };
For this example we will write a simple program and compile it with clang:
#include <sys/time.h>
#include <stdio.h>
int main()
{
struct timeval current_time;
gettimeofday(¤t_time, NULL);
printf("seconds : %ld\nmicro seconds : %ld\n",
current_time.tv_sec, current_time.tv_usec);
printf("%p", ¤t_time);
getchar();
return 0;
}
clang -Wall timeofday.c -o timeofday
Running the program should print the current date in EPOCH format, as well as the location of the the current_time struct. Finally, getchar() is added so that the application does not automatically terminate.
$ ./timeofday
seconds : 1682952033
micro seconds : 690225
0x16d4e35e8
As we have the location of the struct in memory (0x7fff4a1f8d48), we can use Frida to read out the different values. Leave the program running, and attach to it with Frida:
$ frida -n timeofday
We can create a pointer and use readLong to read both values:
[Local::timeofday]-> structPtr = ptr(0x16d4e35e8)
"0x16d4e35e8"
[Local::timeofday]-> structPtr.readLong()
"1682952033"
As we can see, the first member is already at offset 0, however we need to get the process pointer size to know the next offset:
[Local::a.out]-> Process.pointerSize
8
Now that we know that the pointerSize is 8, we can infer that long's size will be 8 bytes and place ourselves in the right offset.
[Local::timeofday]-> structPtr.add(8).readLong()
"690225"
WINAPI struct
There are a lot of structures in the Windows API and therefore we need to be confident in our structure parsing skills. We can find these structures in NTDLL calls to represent strings such as UNICODE_STRING and other structures such as the SYSTEMINFO one.
For this example we will take a look at the WINAPI call GetSystemInfo that takes a LPSYSTEM_INFO structure as an argument. The LPSYSTEM_INFO struct is defined as:
typedef struct _SYSTEM_INFO {
  union {
    DWORD dwOemId;
    struct {
      WORD wProcessorArchitecture;
      WORD wReserved;
    } DUMMYSTRUCTNAME;
  } DUMMYUNIONNAME;
  DWORD     dwPageSize;
  LPVOID    lpMinimumApplicationAddress;
  LPVOID    lpMaximumApplicationAddress;
  DWORD_PTR dwActiveProcessorMask;
  DWORD     dwNumberOfProcessors;
  DWORD     dwProcessorType;
  DWORD     dwAllocationGranularity;
  WORD      wProcessorLevel;
  WORD      wProcessorRevision;
} SYSTEM_INFO, *LPSYSTEM_INFO;
Wow! Quite a complicated struct that we have here, right? Let’s first find the size of each offset, especially the ones that can be troublesome such as LPVOID.
On a Windows 10 64-bit system compiled for 32-bit under Visual C++ we get the following values:
| Type | Size |
|---|---|
| WORD | 2 |
| DWORD | 4 |
| DWORD_PTR | 4 |
| LPVOID | 4 |
We can check this is true by calling Process.pointerSize() in an attached process:
[Local::ConsoleApplication2.exe]-> Process.pointerSize
4
Beware that these numbers will change if compiled on 64 bit:
| Type | Size |
|---|---|
| WORD | 2 |
| DWORD | 4 |
| DWORD_PTR | 8 |
| LPVOID | 8 |
Stack alignment
Beware that compilers may align the stack so ALWAYS be careful when calculating offsets
Once we have these values, we can infer the offset for each member. Don’t be afraid of the union keyword, it won’t be affecting our calculations for the time being.
Obtaining all the values is out of the scope of this part, so we focus on calculating a few of them:
dwPageSize
lpMinimumApplicationAddress
dwNumberOfProcessors
Complete offset list:
typedef struct _SYSTEM_INFO {
  union {
    DWORD dwOemId; // offset: 0
    struct {
      WORD wProcessorArchitecture;
      WORD wReserved;
    } DUMMYSTRUCTNAME;
  } DUMMYUNIONNAME;
  DWORD     dwPageSize; // offset: 4
  LPVOID    lpMinimumApplicationAddress; // offset: 8
  LPVOID    lpMaximumApplicationAddress; // offset: 12
  DWORD_PTR dwActiveProcessorMask; // offset: 16
  DWORD     dwNumberOfProcessors; // offset: 20
  DWORD     dwProcessorType; // offset: 24
  DWORD     dwAllocationGranularity; // offset: 28
  WORD      wProcessorLevel; // offset 32
  WORD      wProcessorRevision; // offset 34
} SYSTEM_INFO, *LPSYSTEM_INFO;
And this is the example program that we will be using to test our guesses:
#include <iostream>
#include <Windows.h>
int main()
{
    SYSTEM_INFO sysInfo ;
    GetSystemInfo(&sysInfo);
    printf("%p", &sysInfo);
    getchar();
}
clang -Wall sysinfo.c -o sysinfo
./sysinfo
0x16f8db5e8
Leave the program running and attach with Frida:
$ frida -n sysinfo
[Local::ConsoleApplication2.exe]-> sysInfoPtr = ptr(0x16f8db5e8)
Now that we have the complete offset list, we can get the values of dwPageSize, lpMinimumApplicationAddress, and dwNumberOfProcessors respectively:
[Local::ConsoleApplication2.exe]-> sysInfoPtr.add(4).readInt()
4096
[Local::ConsoleApplication2.exe]-> sysInfoPtr.add(8).readInt()
65536
[Local::ConsoleApplication2.exe]-> sysInfoPtr.add(20).readInt()
8
Tips for calculating structure offsets
The hardest part of interacting with offsets in Frida is calculating each one and that's usually what takes most of the time, but there are some tricks that can be used.
If the structure is documented, such as GetSystemInfo, the values can be figured out by checking the type and the architecture, then inspecting what this value really means (eg. DWORD means 4 bytes). It must always be taken into account that the size of pointer types change based on the program architecture.
Instead of reading the source, another trick is to simply use the function sizeof over a data type to get the sizes of some data types:
printf("%d", sizeof(DWORD));
An alternative approach, which is limited to when there's access to the source, is leveraging clang's memory layout feature to get the complete offset calculation of a struct. For example MSDN's __stat API is defined as:
int _stat(
   const char *path,
   struct _stat *buffer
);
With clang, we can get the record layout with two steps:
$ clang -E [-I] test.c > ptest.c
Which will generate a file that can be later used with the -cc1 parameter:
$ clang -cc1 -fdump-record-layouts ptest.c
And generate us the offsets for each struct member:

With this information if we are interested in obtaining the offset of the member st_size, by checking the above picture the offset should be 20 compiled as a 64-bit application under clang.
Info
In some cases, it is required to add an extra parameter -fms-extensions to enable support for __declspec attributes:
$ clang -cc1 -fdump-record-layouts -fmx-extensions ptest.c
CModule
The CModule API allows us to pass a string of C code and compile it to machine code in memory. It is important to note however that this feature compiles under tinycc and thus is somewhat limited.
CModule is useful for implementing functions that need to run in the highest performance mode. It is also useful for implementing hot callbacks for Interceptor and Stalker with the objective of increasing performance or easier interaction with C objects and pointers.
CModule syntax
new CModule(source, [, symbols])
Source is the string containing C code and symbols is an object where it is possible to specify additional symbol names and their NativePointer values.
It is recommended to define an init and finalize function with the following signature:
void init(void)
void finalize(void)
These methods will automatically be called and can help with initialization and memory clean-up. We can also make use of the method .dispose() of a CModule object when we want to already unmap the module in case we don’t want to wait for normal garbage collection.
const openImpl = Module.getExportByName(null, 'open');

Interceptor.attach(openImpl, new CModule(`
  #include <gum/guminterceptor.h>
  #include <stdio.h>

  void onEnter (GumInvocationContext * ic)
  {
    const char *path;
    path = gum_invocation_context_get_nth_argument (ic, 0);
    printf ("open() path=\\"%s\\"\\n", path);
  }
`));
In this example we are switching out the implementation of the open() function using Interceptor.attach. Instead of having a JavaScript function as the second argument, we have our custom CModule.
First, we need to include the frida-gum library and the standard library. Next, the void onEnter(GumInvocationContext *ic) method is a method that gum recognizes and calls with an InvocationContext. This object contains information available when the function was called but not executed yet.
With this InvocationContext we can call the gum_invocation_context_get_ngth_argument(ic, N) where N is 0 in this case to get the first argument. We can then print the value using <stdio.h>’s printf function.
This however defeats the purpose of writing instrumentation code in JavaScript so use it when you really need performance or for more complex tasks.
CModule: A practical use case
In this example we are going to work with the UNIX library <sys/time.h> with the same struct as we have seen before (timeval).
In this use case our aim is to be able to read the timeval structure with ease, however, as we mentioned before, we do not have access to libs outside of tinycc but it is possible to pass to CModule as an argument {toolchain: “external”} so that it is able to work with system libs but it is important to note that as of the time of writing this is only supported in MacOS and (some)Linux systems – I tested this under MacOs 11.1 and Debian 10.
This is a ‘hidden’ argument (in the sense that there is not much documentation, you would have to read test cases to know it exists) that you can use and is indeed very useful and this leaves us with the following syntax when creating CModule objects:
new CModule(`c_code_goes_here`, symbols, {toolchain: ‘external|internal|any’});
Alright, so we have the same program as the SYSCALL structure part. We are going to use that as a base program to test this feature out.
What we want to achieve with this example:
- Replicating the
onEnterbehaviour - Saving
InvocationStateswithin callbacks (this is, sharing arguments, thread states, etc…) - Printing the first parameter of the struct tv_secs on the onLeave callback.
- Note: this example uses void * arg which is not recommended and instead gpointer should be used, but I think this is a more familiar case.
#include <gum/guminterceptor.h>
#include <stdio.h>
#include <sys/time.h>

typedef struct _IcState IcState;
struct _IcState
{
  void * arg;
};

void onEnter(GumInvocationContext *ic){
  IcState * is = GUM_IC_GET_INVOCATION_DATA(ic, IcState);
  is->arg = gum_invocation_context_get_nth_argument(ic, 0);
  printf("%p\\n", is->arg);
}

void onLeave(GumInvocationContext * ic)
{
  IcState * is = GUM_IC_GET_INVOCATION_DATA(ic, IcState);
  printf("%p\\n", is->arg);
  struct timeval * t = (struct timeval*)is->arg;
  printf("timeval: %ld\\n\\n", t->tv_sec, t->tv_usec);
}
Notes: This way of coding is a bit different to standard programs because we want to operate with callbacks. We use \n with two backslashes because this string is inside a JavaScript multiline one.
First we include <gum/guminterceptor.h> so that we are able to access the onEnter and onLeave callbacks.
We also need to store the InvocationState between callbacks, so we are creating a struct named IcState that stores a single member:
void *arg;
Now we have the onEnter callback in C:
void onEnter(GumInvocationContext)
With this context we are able to use auxiliary functions of the gum API such as GUM_IC_GET_INVOCATION_DATA which we will use for initializing the struct and gum_invocation_context_get_nth_argument to get the argument.
We store the first argument in the IcState struct:
is->arg = gum_invocation_context_get_nth_argument(ic, 0);
and then we are able to use it in our onLeave callback, but first we need to cast the argument so that we are able to use the struct:
struct timeval * t = (struct timeval*)is->arg;
And then we are able to access the timeval struct argument with t.tv_secsand t.tv_usecs.
And this should be the expected output:
[Local::a.out]-> cmodule struct pointer: 0x7ffd8e826e00
Myprogram struct pointer 0x7ffd8e826e00
cmodule timeval: 1612343654
cmodule usec: 263111
myprogram seconds : 1612343654
myprogram micro seconds : 263111
CModule: Reading return values
It is possible to read the return value of an instrumented function from CModule. We will see now a brief example on how to do it:
void
onLeave(GumInvocationContext * ic)
{
    int retval;
    retval = (int) gum_invocation_context_get_return_value(ic);

    printf("=> return value=%d\\n", retval);
}
This example assumes that the return value is an integer but there is however a cleaner way to solve this:
void
onLeave(GumInvocationContext * ic)
{
    const int retval = GPOINTER_TO_INT(gum_invocation_context_get_return_value(ic));

    printf("=> return value=%d\\n", retval);
}
See GPOINTER_TO_INT? What gum_invocation_context_get_return_value is returning is not the return value itself but a pointer (which is why we always have NativePointers when working in JS) - And we need to cast it to an integer be it with (int) or using the GPOINTER_TO_INT API
Which translates into the same result but stays always in sync with frida-gum's API.
CModule vs JavaScript agent performance
Once the instrumentation agent is written, there are situations where the agent reaches a practical state but is still too slow due to JavaScript VM exits or simply heavy workloads (networking, memory, file operations...). For these scenarios, it is important to take into account the performance upgrade of CModule.
To test how performant CModule is against the same instrumentation script in JavaScript let's use the following C program:
#include <stdio.h>
#include <math.h>
#include <stdlib.h>
#include <time.h>

double local_sqrt(double a) {
    return sqrt(a);
}

int main() {
    clock_t t;
    t = clock();
    for(int i = 0; i < 100000; i++) {
        local_sqrt((double)i);
    }
    t = clock() - t;
    double total_time = (double)t / CLOCKS_PER_SEC;
    printf("Time ellapsed: %f", total_time);

    return 0;
}
Compiled with $ clang -lm main.c
This program just takes a number from the for iteration and calculates its square root. When executed without instrumentation it takes 0.002 seconds to complete.
Now, to test how instrumentation affects performance the following instrumentation script is used:
const localSqrtPtr = ptr(0x401140);

Interceptor.attach(localSqrtPtr, {
    onLeave: function(retval) {
        console.log(retval);
    }
    });
This script simply instruments the double localSqrtPtr(double) function and prints the return value on screen. When executing this script using QuickJS runtime, it takes 5.8 seconds to complete. With JavaScript's V8 as runtime it takes 5.321 seconds.
On the other hand, let's see what happens when CModule is used for the same purpose:
const localSqrtPtr = ptr(0x401140);

Interceptor.attach(localSqrtPtr, new CModule(`
    #include <stdio.h>
    #include <gum/guminterceptor.h>

    void onLeave(GumInvocationContext * ic)
    {
        double fd;
        fd = (double) gum_invocation_context_get_return_value(ic);
        printf("cmodule: %.2lf\n", fd);
    }
`));
When executed using CModule in the instrumentation script and printing all the arguments, it takes 1.3 seconds to complete.
The difference is very noticeable thus when writing instrumentation scripts it is recommended to first write all the logic in JavaScript and see how the instrumented target performs. If this performance is sufficient for the task there is no need for further optimizations, but in case that more performance is needed CModule provides a new world for optimizing tasks.
Info
It is important to notice that VM exits performance slowdown is paid for every transaction. This means that whenever an onEnter or onLeave callback finishes and the instrumentation script tries to access a variable from CModule that performance slowdown is paid and hinders the performance capabilities of CModule. In the previously shown example all the functionality is contained within CModule(it is not returning values to the JavaScript side) and thus the performance gain is significant.
CModule: Sharing state between JS and C
When instrumenting some binaries eventually we might get across some calls that are a hotspot, this means that they are being called too many times per second and are paying a high performance toll for being instrumented using the JS side of Frida. Frida allows us to instrument code using CModule and only accessing the required values of the instrumented function whenever it is needed, reducing the toll on the instrumented binary performance while still allowing the user to keep their JS instrumentation code.
To do this we will use the previous program that repeatedly calls the sqrt function and share the return value with our JS code. To prepare for this scenario the first step in our JS code is to allocate a buffer to share with our CModule:
const sqrtReturnPtr = Memory.alloc(4);
This creates a NativePointer that is going to be shared with our CModule code. Our CModule code then looks like this:
const myCm = new CModule(`
  #include <gum/guminterceptor.h>
  extern double sqrtReturnPtr;
  void onLeave(GumInvocationContext * ic)
  {
    double result;
    result = (double)gum_invocation_context_get_return_value(ic);
    sqrtReturnPtr = result;
  }
`, {sqrtReturnPtr})
The second argument of the CModule constructor allows to pass symbols with the following Syntax:
new CModule(/c code/, { symbol_1, symbol_2, ...<n> });
The C code has an extern variable declared that is shared between our JS instrumentation code and our C Code. Our JS code sees this variable as a NativePointer and only pays the performance price when accessing this variable.
To test this out, we are going to increase the size of the for loop to ensure that the application takes longer to finish and call setTimeout to get the current return value after 2 seconds:
Interceptor.attach(localSqrtPtr, cm);

setTimeout(() => {
  console.log("sqrt value after 2 seconds: " + sqrtReturnPtr.readDouble());
}, 2000)
sqrtReturnPtr is a shared pointer between our CModule and our JS code so in order to obtain the real value it is needed to call the .readDouble API to get the value. The same goes for other datatypes: int, char[], float... Finally when instrumenting the aforementioned application this is the output obtained:
[Local::a.out ]-> sqrt value after 2 seconds: 8915179
Shared state can also be done with the onEnter callback, or when using NativeFunctions that interact with CModule's code. Use it wisely!
Sharing state between two CModule objects
The previous example showed how to share state/variables between our JS code and the C code, but what if there are two different functions to instrument and need to share their state? This can be done by using the second parameter of the CModule constructor as seen before. For this example the same code as the previous section is reused. This time however, an extra function is added:
const cmFunction = new CModule(`
  #include <stdio.h>

  extern double sqrtReturnPtr;

  void printCurrentValue()
  {
    printf("sqrt current value: %d", sqrtReturnPtr);
  }`, {sqrtReturnPtr});
This code exposes the function void printCurrentValue() that prints the current shared value of sqrtReturnPtr. However, to be able to call this function from our JS code a NativeFunction is required:
const printCurrentValue = new NativeFunction(cmFunction.printCurrentValue, 'int', []);
cmFunction.printCurrentValue returns the pointer to the function, and the NativeFunction constructor replicates its definition returning a callable function from JS. The aforementioned code that calls .setTimeout can then be replaced with a call to our CModule function:
setTimeout(() => {
    printCurrentValue();
}, 1000);
And then when instrumenting our application it shows the following input:
sqrt current value: 861554496
Notifying from C code
Another use case when using CModule might be allowing the C code to work on its own and only report feedback to JS when needed. This can be done by passing a NativeCallback when creating a CModule and calling this function from C which triggers the NativeCallback on the JS side.
To illustrate this example the previous square root example is going to be reused with the purpose of notifying the JS code only when the result of the square root operation modulo 10000 is 0. The for loop now iterates up to 100000 the notification should only arrive 9 times in total. The first step is adding to the CModule code an extern declaration of the function that will notify the JS code:
extern void notify_from_c(const double * value);
This function can now be called from the CModule side this way notify_from_c(&value);. The next step is adding in the JS side the CModule symbols a callback that receives the value from the notify_from_c function and acts on it. This is done by expanding the symbols argument in the CModule constructor:
const cm = new CModule(`/* code goes here*/`, {
  sqrtReturnPtr,
  notify_from_c: new NativeCallback(notifyPtr => {
    const notifyValue = notifyPtr.readDouble();
    console.log('cmodule notify_from_c:' + notifyValue);
  }, 'void', ['pointer'])
});
With this set the onLeave callback in our CModule will call the notify_from_c function whenever the square root value modulus of 10000 is zero:
const cm = new CModule(`
    #include <gum/guminterceptor.h>

    extern double sqrtReturnPtr;
    extern void notify_from_c(const double * value);

    void onLeave(GumInvocationContext * ic)
    {
      double result;
      result = (double)gum_invocation_context_get_return_value(ic);
      sqrtReturnPtr = result;
      if ((int)sqrtReturnPtr % 1337 == 0)
      {
        notify_from_c(&sqrtReturnPtr);
      }
    }
  `, {
  sqrtReturnPtr,
  notify_from_c: new NativeCallback(notifyPtr => {
    const notifyValue = notifyPtr.readDouble();
    console.log('notification from C code, value: ' + notifyValue);
  }, 'void', ['pointer'])
});
When executing this script against the target program we get the following output:
[Local::a.out ]-> notification from C code, value: 0
notification from C code, value: 10000
notification from C code, value: 20000
notification from C code, value: 30000
notification from C code, value: 40000
notification from C code, value: 50000
notification from C code, value: 60000
notification from C code, value: 70000
notification from C code, value: 80000
notification from C code, value: 90000
Time ellapsed: 0.024194
It is interesting to make use of these notifications whenever the C code can mostly do work on its own and only sending data back to JS or acting on the received data is required.
CModule boilerplates
Until now we only were exposed to the GUM APIs I have shown you in the example, this is due to the fact that when this was written CModule had still to be written checking against source code for types and functions, however since frida 14.2.12 it is possible to generate a boilerplate for CModule with the most commonly used methods:
frida-create cmodule|agent
agent: creates a boilerplate of a TypeScript agent.cmodule: Creates a boilerplate of a CModule, which includes all the built-in headers and so an external toolchain can be used. This adds support for code-completion in your editor of choice.
Be careful, because this command creates the boilerplate in the current working directory!
Once you execute frida-create cmodule, this is what you should get in a boilerplate:
$ ls
include/     meson.build  test.c
$ ls include/
capstone.h  glib.h      gum/        json-glib/  platform.h  x86.h
$ ls include/gum/
arch-x86/         guminterceptor.h  gummetalarray.h   gummodulemap.h    gumspinlock.h
gumdefs.h         gummemory.h       gummetalhash.h    gumprocess.h      gumstalker.h
And the .c file should look like this:
#include <gum/guminterceptor.h>

static void frida_log (const char * format, ...);
extern void _frida_log (const gchar * message);

void
init (void)
{
  frida_log ("init()");
}

void
finalize (void)
{
  frida_log ("finalize()");
}

void
on_enter (GumInvocationContext * ic)
{
  gpointer arg0;

  arg0 = gum_invocation_context_get_nth_argument (ic, 0);

  frida_log ("on_enter() arg0=%p", arg0);
}

void
on_leave (GumInvocationContext * ic)
{
  gpointer retval;

  retval = gum_invocation_context_get_return_value (ic);

  frida_log ("on_leave() retval=%p", retval);
}

static void
frida_log (const char * format,
           ...)
{
  gchar * message;
  va_list args;

  va_start (args, format);
  message = g_strdup_vprintf (format, args);
  va_end (args);

  _frida_log (message);

  g_free (message);
}
We can now have the basic methods include or modify them to suit our needs, we also have access to GumInvocationContext members and type-checking.
To build the CModule, the following commands are required:
$ meson build && ninja -C build
With the cmodule.so file generated, it can be injected to our target process via:
frida -C cmodule.so <PID>
Stalker
Stalker is a code tracing engine which allows following threads and capture every function, block and instruction being called. Explaining how a code tracer works is out of the scope of this book, however if you are interested you can read about the anatomy of a code tracer.
It is possible to run stalker directly using C (via frida-gum) but we will focus on using it from JS. This is the basic syntax of Stalker (to follow what is happening on a thread):
Stalker.follow([threadId, options])
Where threadId is the thread id we want to follow and options is for enabling events to trace:
  events: {
    call: true, // CALL instructions: yes please
    ret: false, // RET instructions
    exec: false, // all instructions
    block: false, // block executed: coarse execution trace
    compile: false // block compiled: useful for coverage
  }
Only use the exec option when you are sure you need it because it takes a huge impact on performance and it is a lot of data to digest for Frida.
Obtaining a thread id
As we have seen before, we need to get a thread identifier to use Stalker, we will see how to get one:
Obtaining the process' thread list via Process.enumerateThreadsSync() returns a list of threads:
[
    {
        "context": {
            "pc": "0x113341568",
            "r10": "0x10f363000",
            "r11": "0x246",
            "r12": "0x10f363578",
            "r13": "0x0",
            "r14": "0x1133e3298",
            "r15": "0x1133eb070",
            "r8": "0x31",
            "r9": "0x0",
            "rax": "0x1133c7132",
            "rbp": "0x7ffee089c8d0",
            "rbx": "0x3722d28603514",
            "rcx": "0x10f363000",
            "rdi": "0x1133e46e0",
            "rdx": "0x0",
            "rip": "0x113341568",
            "rsi": "0x4",
            "rsp": "0x7ffee089bab8",
            "sp": "0x7ffee089bab8"
        },
        "id": 1031,
        "state": "waiting"
    }
]
From within a instrumented function using this.threadId:
Interceptor.attach(myInstrumentedFunction, {
    onEnter (args) {
        Stalker.follow(this.threadId, {
            // ...
        });
        // ...
    }
    onLeave (retval) {
        Stalker.unfollow(this.threadId);
    }
});
In case that you want to follow the thread where an instrumented function is called, the second method is the preferred one.
Stalker: Tracing from a known function call
Now, we will see the Stalker engine in action. For this example, we will use a basic program that tries to open a file:
#include <stdio.h>
#include <stdlib.h>
#include <fcntl.h>
#include <unistd.h>

int
main(int argc, char *argv[])
{
    pause();
    int fd;
    fd = open("code.dat", O_RDONLY);
    if (fd == -1)
    {
        fprintf(stderr, "file not found\n");
    }

    return 0;
}
Once we compile it, we will open it in Frida's REPL and check its exports:
[Local::a.out]-> Module.enumerateExportsSync("a.out")
[
    {
        "address": "0x10bfa8000",
        "name": "_mh_execute_header",
        "type": "variable"
    },
    {
        "address": "0x10bfabf00",
        "name": "main",
        "type": "function"
    }
]
As we can see, the main function is exported and it is a good enough entrypoint for our code tracing to begin:
let mainPtr = Module.getExportByName(null, "main");
Interceptor.attach(mainPtr, {
  onEnter (args) {
   Stalker.follow(this.threadId, {
      events: {
        call: true,
        ret: false,
        exec: false,
        block: false,
        compile: false,
      },
      onReceive: function (events) {
        var calls = Stalker.parse(events, {
          annotate: true,
        });
        for (var i = 0; i < calls.length; i++) {
          let call = calls[i];
          console.log(call[2]);
        }
      },
      onCallSummary: function (summary) {
        console.log(JSON.stringify(summary, null, 4));
      }
    });
  },

  onLeave(retval) {
    Stalker.unfollow(this.threadId);
  }
});
Now let's break down this script before we execute it:
onEnter (args) {
   Stalker.follow(this.threadId, {
      events: {
        call: true,
        ret: false,
        exec: false,
        block: false,
        compile: false,
      },
Stalker.follow is set to follow the thread id of every call to main() however this is only called once.
onReceive: function (events) {
        var calls = Stalker.parse(events, {
          annotate: true,
        });
        for (var i = 0; i < calls.length; i++) {
          let call = calls[i];
          console.log(call[2]);
        }
      },
The onReceive callback receives every event collected. We can parse the events using Stalker.parse built-in method to get a list of events which include the event type, the parent caller, and the callee. We can leverage this to our advantage and print he callee which is at call[2].
onCallSummary: function (summary) {
  console.log(JSON.stringify(summary, null, 4));
}
onCallSummary callback returns a summary of what has been called throughout the lifetime of the Stalker object and how many times it was called. We can pretty print this via console.log.
Finally, we will run the stalker script:
frida -l stalker.js -f a.out --no-pause
And we will get the following output displaying each called address and the total times it was called (for illustration purposes, only the summary will be properly displayed):
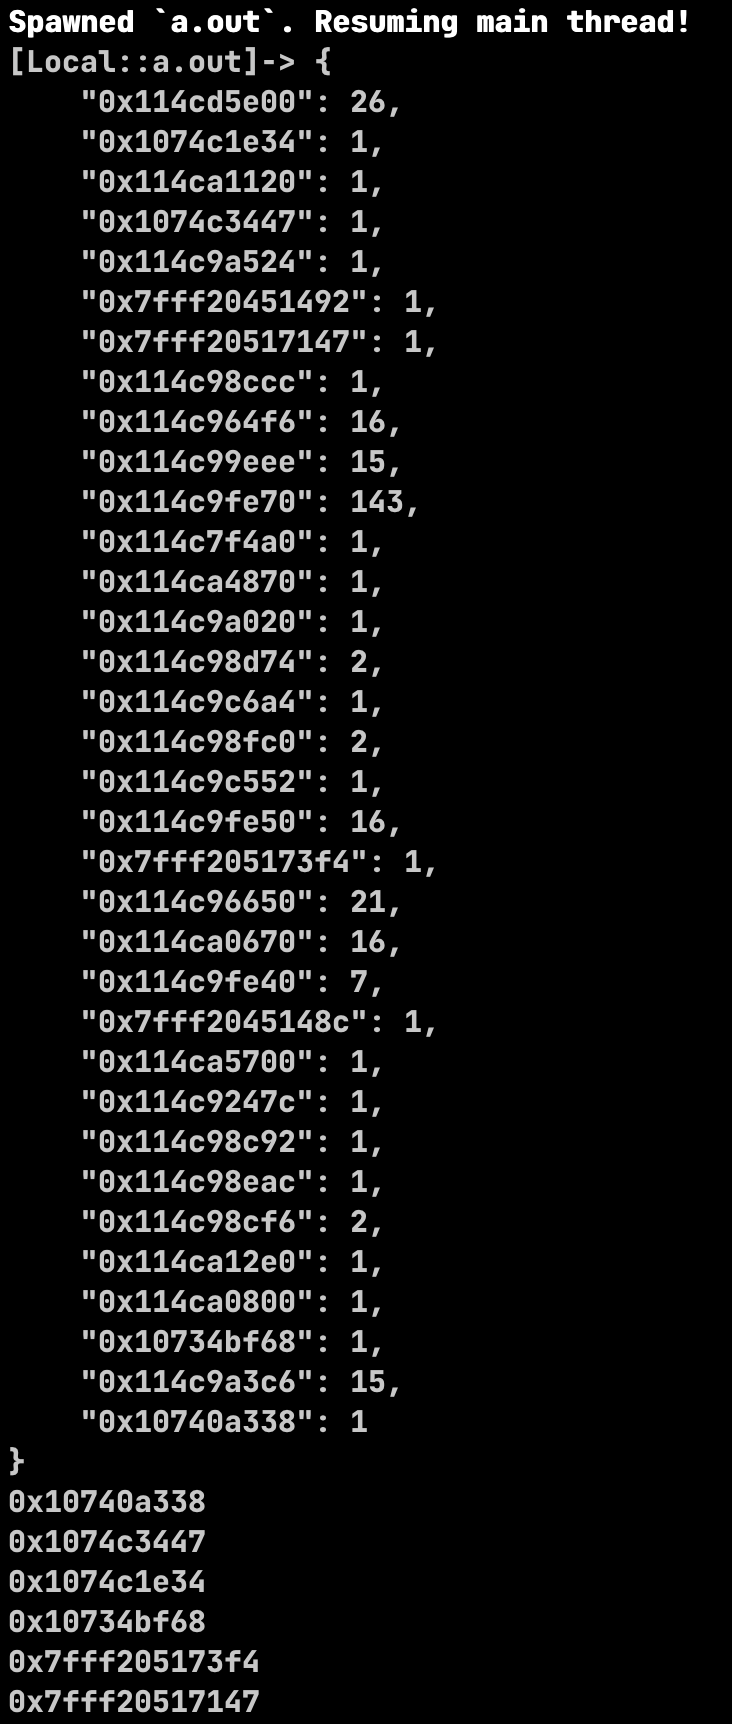
Tracing instructions
In our previous example we were only tracing call instructions to obtain the address of the function being called. It is also possible using the transform callback to log all the instructions we are tracing.
In this example we will only trace instructions without any further processing using the previous example program (you can use whichever program you want to try it on).
Inside our previous Stalker code, we will insert a new callback named transform and its argument will be iterator which acts as an iterator:
      transform: function (iterator) {
    let instruction = iterator.next();
    do {
        console.log(instruction);
        iterator.keep();
    } while ( (instruction = iterator.next()) !== null );
      }
Each item of the iterator contains the instruction(s) executed, so we can keep iterating until none are left. This instruction object is special since not only it contains the instructions but also the .address, .mnemonic, members. We will see more detailed examples covering these members.
For now, our console.log(instruction) is only logging the complete instruction being traced, and our output will be this:
push rbp
mov rbp, rsp
push r15
push r14
push r13
push r12
push rbx
sub rsp, 0xb8
mov qword ptr [rbp - 0xd8], r9
mov r12, r8
mov r13, rcx
mov rbx, rdx
mov r15, rsi
mov r14, rdi
lea rax, [rip + 0x6870031f]
mov rax, qword ptr [rax]
mov qword ptr [rbp - 0x30], rax
movsx eax, word ptr [rdx + 0x10]
test al, 8
je 0x7fff2043972d
bt eax, 9
jb 0x7fff2043974e
cmp qword ptr [rbx + 0x18], 0
And we can get a trace of all the instructions being executed in real-time. It is also possible to filter out given a certain mnemonic:
      transform: function (iterator) {
    let instruction = iterator.next();
    do {
        if (instruction.mnemonic === 'jne') {
            console.log(instruction);
        }
        iterator.keep();
    } while ( (instruction = iterator.next()) !== null );
      }
Will check all mnemonics a print only the JNE ones:
jne 0x7fff20409785
jne 0x7fff20409753
jne 0x7fff20410fe3
jne 0x7fff2040c0e0
jne 0x7fff20416095
jne 0x7fff204399fc
jne 0x7fff204f9259
jne 0x7fff204f93f7
jne 0x7fff204f9375
jne 0x7fff204f93e1
jne 0x7fff204f9407
jne 0x7fff204f937e
jne 0x7fff2041007b
Getting RET addresses
It is possible to use the putCallout method to safely store the context values of the instruction at the time of its execution. putCallout passes a callback and returns a context object with access to CPU registers and the ability to read/modify them.
In this example, we can take advantage of putCallout to log the addresses that a RET instruction returns to:
let statPtr = Module.getExportByName(null, "main");
Interceptor.attach(statPtr, {
    onEnter(args) {
        Stalker.follow(this.threadId,
            transform: function(iterator) {
                let instruction = iterator.next();
                do {
                    if (instruction.mnemonic == 'ret') {
                        iterator.putCallout(printRet);
                    }
                    iterator.keep();
                } while ((instruction = iterator.next()) !== null);
            },

        });
},

onLeave(retval) {
    Stalker.unfollow(this.threadId);
}
});

function printRet(context) {
    console.log('RET @ ' + context.pc);
}
And returns:
RET @ 0x10ac8ee8a
RET @ 0x10ac8ee8a
RET @ 0x10ac8ee8a
RET @ 0x10ac8ee8a
RET @ 0x10ac8ee8a
RET @ 0x10ac8ee8a
RET @ 0x10ac8901e