r2frida
r2frida is a plugin for radare2, a reverse engineering framework. This plugin aims to join the capabilities of static analysis of radare2 and the instrumentation provided by Frida. Even though it is possible to achieve similar results using only Frida alone (when it comes to in-memory related stuff) having the power of radare2 joined to assemble patches in memory and static analysis all-in-one makes it a great tandem.
In order to get this plugin working a working radare2 setup is required. From now, radare2 will be referred to asr2. To get r2 setup in your environment, please refer to their INSTALL.md.
To setup this plugin, the simplest way is by running radare2's package manager:
r2pm -ci r2frida
r2frida commands
When searching for r2frida documentation or blogposts, it is likely that you will find commands starting with backslash \. This is the old way of running commands with r2frida, commands are now run starting with :.
Testing r2frida setup
In order to confirm that r2frida is setup properly, it simplest way of doing so is by running it against a known binary. In this case /bin/ls is a good candidate for it in unix systems:
r2 frida:///bin/ls
And then it should get into r2's shell:
$ r2 frida:///bin/ls
 -- This binary no good. Try another.
[0x00000000]>
[0x00000000]> :?V
{"version":"15.1.17"}
To test this out there are other commands that you could use:
[0x00000000]> :i  # information about the process and frida runtime
arch                x86
bits                64
os                  linux
pid                 9502
uid                 1000
objc                false
runtime             QJS
swift               false
java                false
mainLoop            false
pageSize            4096
pointerSize         8
codeSigningPolicy   optional
isDebuggerAttached  true
cwd                 /home/jedi
[0x00000000]> :dp  # prints the PID of the process
9502
Congratulations, your r2frida setup is now working!
Attaching to running processes.
To attach to already running processes, the name or the PID of the process is required instead of the absolute path:
For a PID: r2 frida://<PID>. For example r2 frida://1234
For a process name: r2 frida://<PROCESS_NAME>. For example r2 frida://notepad.exe
Tracing functions
r2frida allows the user to trace functions without writing instrumentation code. To do so, it is possible to use the command dt(=trace) and dtf(=trace format). :dtf allows to format the output of the traced functions, instrument onEnter blocks and display backtraces. When typing :dtf? it displays the following help:
Usage: dtf [format] || dtf [addr] [fmt]
  ^  = trace onEnter instead of onExit
  +  = show backtrace on trace
 p/x = show pointer in hexadecimal
  c  = show value as a string (char)
  i  = show decimal argument
  z  = show pointer to string
  w  = show pointer to UTF-16 string
  a  = show pointer to ANSI string
  h  = hexdump from pointer (optional length, h16 to dump 16 bytes)
  H  = hexdump from pointer (optional position of length argument, H1 to dump args[1] bytes)
  s  = show string in place
  O  = show pointer to ObjC object
Undocumented: Z, S
 dtf    trace format
For example, to instrument a function that receives a const char* as the first argument it is possible to do so by:
:dtf 0x7f101d1ed000 z^
z will read the first argument as a UTF-8 string and ^ traces the onEnter instead of the onLeave block. To understand how to use the tracing command it is better to do it through practical examples.
Tracing functions from imports/exports
The easiest path to instrument function is whenever these functions are easily obtainable from the process' imports and exports. Through r2frida it is possible to retrieve the address of the function that we want to instrument by using the :iE command but before going further; we will get a known binary to test with: wget.
To instrument wget with parameters in r2frida it is done this way:
r2 "frida:///wget man7.org"
Note that the unlike the previous example where r2frida was spawned this time the frida:/// block is surrounded by double quotes, this allows to pass arguments to the target binary. The target function to instrument in this case is fopen that receives the filename in the first argument and mode in second argument both as const char*'s. Once we are in the r2 shell we should have tue following console:
r2 "frida:///usr/bin/wget man7.org"
r_config_set: variable 'asm.cmtright' not found
 -- If you're having fun using radare2, odds are that you're doing something wrong.
[0x00000000]>
fopen is a function imported from libc and to be able to list the imports/exports of this module we need to position ourselves in the correct module address. To do so, we can use the :dm command to enumerate modules and their addresses:
0x0000560be7abb000 - 0x0000560be7b2e000 r-x /usr/bin/wget
0x0000560be7d2e000 - 0x0000560be7d32000 r-- /usr/bin/wget
0x0000560be7d32000 - 0x0000560be7d35000 rw- /usr/bin/wget
0x0000560be7d35000 - 0x0000560be7d3c000 rw-
[...]
0x00007ff0a9db9000 - 0x00007ff0a9df7000 r-x /lib/x86_64-linux-gnu/libc-2.27.so
0x00007ff0a9df7000 - 0x00007ff0a9df8000 rwx /lib/x86_64-linux-gnu/libc-2.27.so
0x00007ff0a9df8000 - 0x00007ff0a9df9000 r-x /lib/x86_64-linux-gnu/libc-2.27.so
[...]
The output has been shortened, but the important bit is the first entry of libc-2.27.so. By entering the address in r2's console, we position ourselves in the module address:
[0x00000000]> 0x00007ff0a9db9000
[0x7ff0a9db9000]>
From here, it is possible to enumerate exports by using the :iE command. However, the output of :iE is huge and to filter out the results to those containing fopen the ~ operator allows to do so:
[0x7ff0a9db9000]> :iE~fopen
0x7ff0a9e45450 f _IO_file_fopen
0x7ff0a9e37de0 f fopen
0x7ff0a9e380d0 f fopencookie
0x7ff0a9e37de0 f _IO_fopen
0x7ff0a9e37de0 f fopen64
[0x7ff0a9db9000]>
0x7ff0a9e37de0 is the memory address of the libc's fopen and as mentioned before it contains two arguments that can be read as UTF8 strings. With this information it is now possible to use the :dtf: command to trace the function and print out the values of each argument:
[0x7ff0a9db9000]> :dtf 0x7ff0a9e37de0 zz^
true
[0x7ff0a9db9000]> :dc
resumed spawned process.
The :dtf command returns true signaling that the command was issued succesfully. z will display the value read as an UTF8String and the second z will do the same thing for the second argument. '^' also shows the backtrace of the function. To resume execution, the :dc does so.
I> It is possible to combine different format types for different arguments, for example it is possible to print the hexdump of the second argument instead by replacing z with h: :dtf 0x7ff0a9e37de0 zh^
When the execution is resumed, the following output is showed in our console:
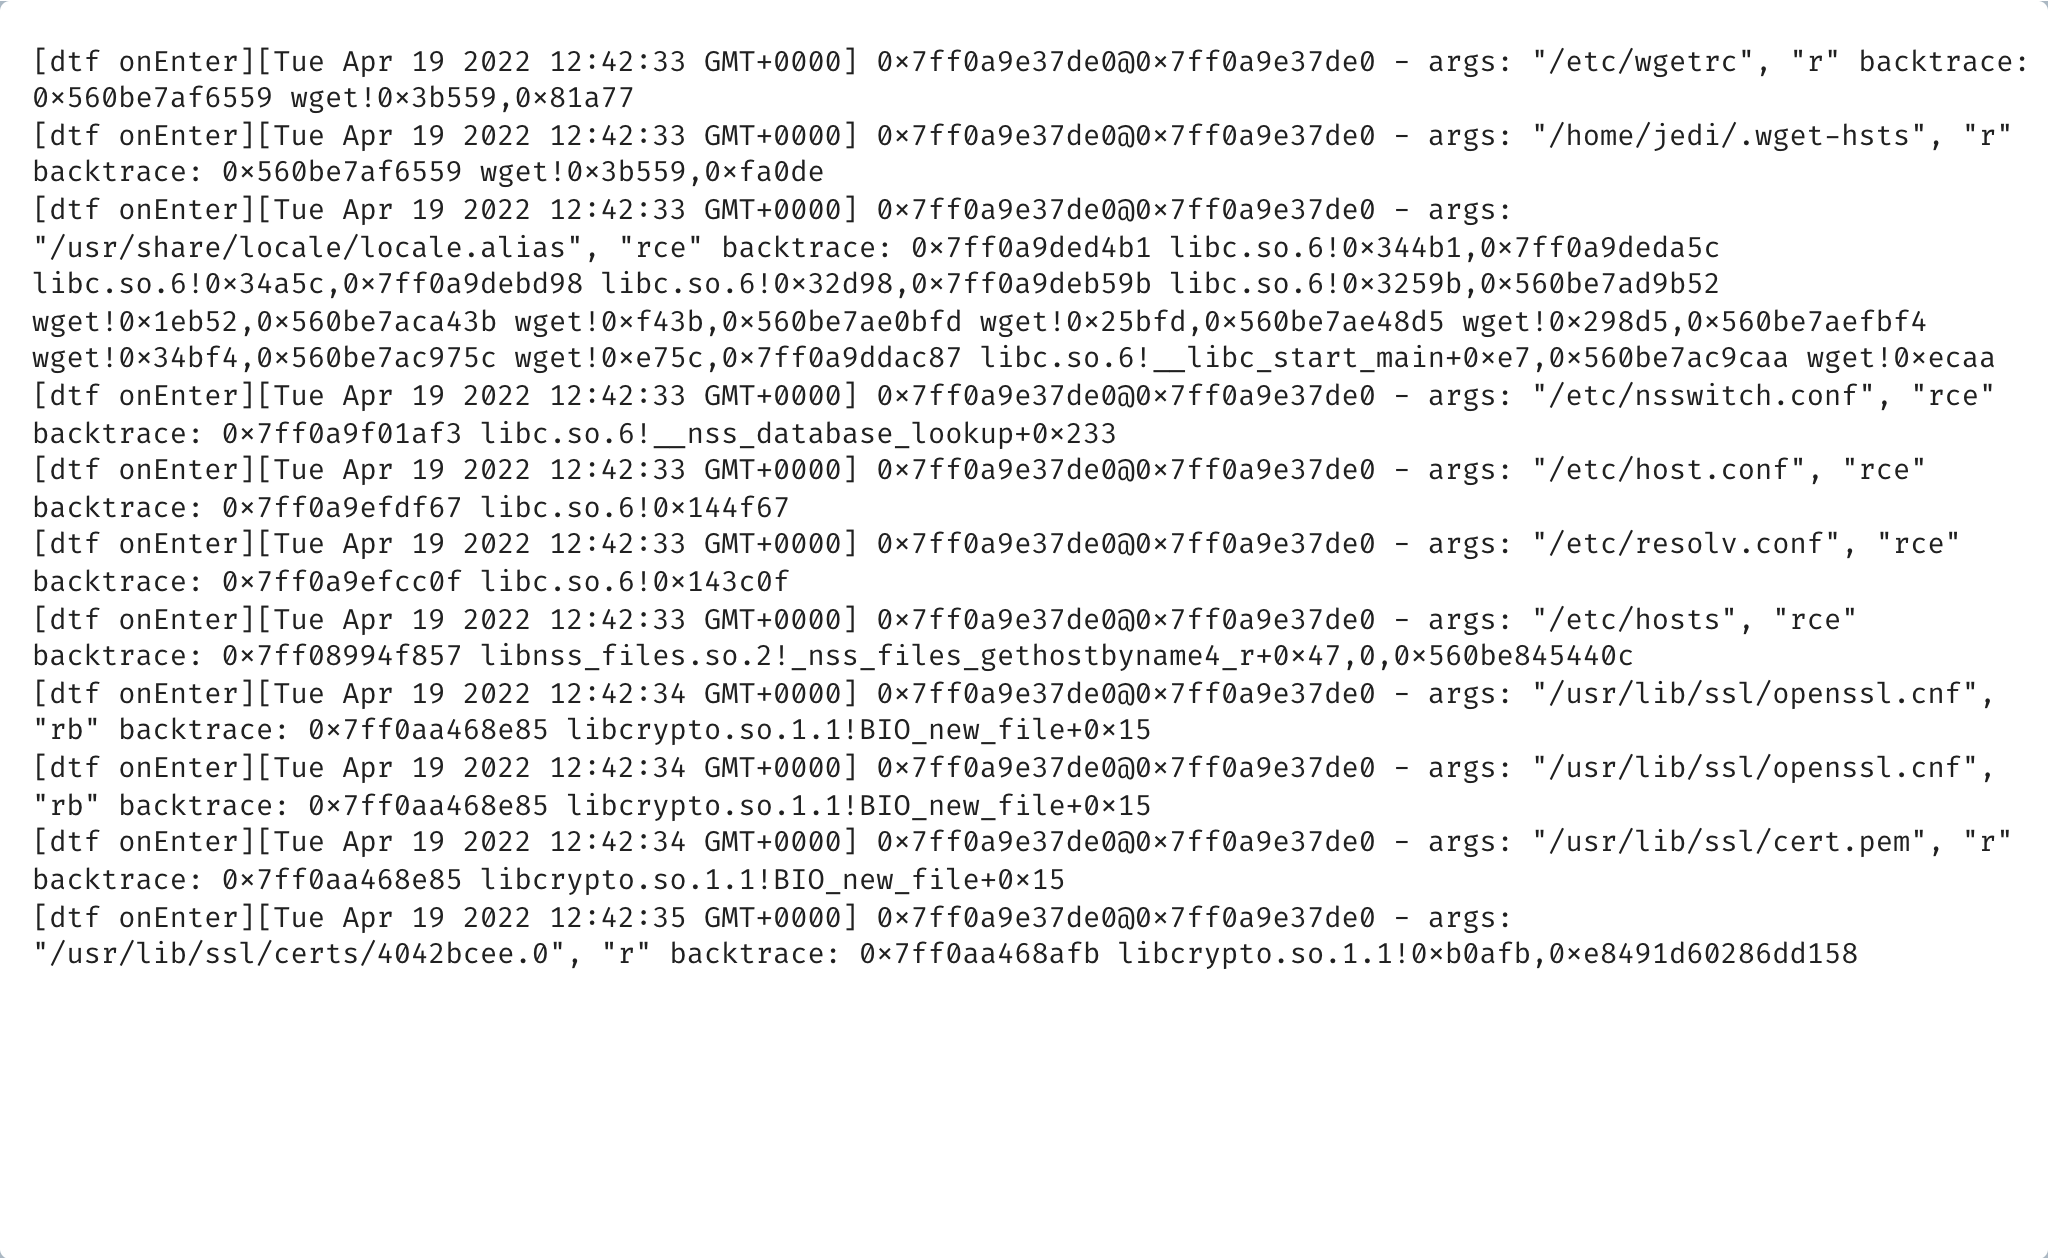
The output has been filtered to include only the interesting bits, but it can be seen that each argument is interpreted correctly as a UTF8 string and displayed along their backtrace.
Tracing functions by using offsets
Unlike the previous section, this time the objective is to instrument a function that is not directly listed in the imports/exports table which is something common when tracing functions. In this situation what we need to do is to retrieve the offset to the function(s) that are to be instrumented.
To illustrate this example, the following code will be used to trace the memcmp and check functions:
// gcc check_password.c
#include <stdio.h>
#include <stdlib.h>
#include <string.h>

// Damn_YoU_Got_The_Flag
char password[] = "\x18\x3d\x31\x32\x03\x05\x33\x09\x03\x1b\x33\x28\x03\x08\x34\x39\x03\x1a\x30\x3d\x3b";

inline int check(char* input);

int check(char* input) {
  for (int i = 0; i < sizeof(password) - 1; ++i) {
    password[i] ^= 0x5c;
  }
  return memcmp(password, input, sizeof(password) - 1);
}

int main(int argc, char **argv) {
  if (argc != 2) {
    printf("Usage: %s <password>\n", argv[0]);
    return EXIT_FAILURE;
  }
  int size_of_password = (sizeof(password) - 1);
  printf("size: %d", size_of_password);
  if (strlen(argv[1]) == (sizeof(password) - 1) && check(argv[1]) == 0) {
    puts("You got it !!");
    return EXIT_SUCCESS;
  }

  puts("Wrong");
  return EXIT_FAILURE;

}
This time the code is compiled using gcc and when opening in in r2frida and inspecting the imports/exports of the binary it is a blank slate:
[0x00000000]> :dm
0x00005591d1947000 - 0x00005591d1948000 r-x /tmp/a.out
0x00005591d1b47000 - 0x00005591d1b48000 r-- /tmp/a.out
0x00005591d1b48000 - 0x00005591d1b49000 rw- /tmp/a.out
# ...
[0x00000000]> s 0x00005591d1947000
[0x5591d1947000]> :iE
[0x5591d1947000]> :ii
[0x5591d1947000]>
When opening this binary with r2 -A to analyze it, this is the output obtained when listing functions:
$ r2 -A a.out
[0x00000610]> afl
0x00000610    1 42           entry0
0x00000640    4 50   -> 40   sym.deregister_tm_clones
0x00000680    4 66   -> 57   sym.register_tm_clones
0x000006d0    5 58   -> 51   sym.__do_global_dtors_aux
0x00000600    1 6            sym.imp.__cxa_finalize
0x00000710    1 10           entry.init0
0x000008a0    1 2            sym.__libc_csu_fini
0x000008a4    1 9            sym._fini
0x00000830    4 101          sym.__libc_csu_init
0x0000077b    7 170          main
0x0000071a    4 97           sym.check
0x00000598    3 23           sym._init
0x000005c0    1 6            sym.imp.puts
0x000005d0    1 6            sym.imp.strlen
0x000005e0    1 6            sym.imp.printf
0x00000000    2 25           loc.imp._ITM_deregisterTMCloneTable
0x000005f0    1 6            sym.imp.memcmp
0x000001a5    1 38           fcn.000001a5
[0x00000610]>
What is seen in the first column are the offsets for the functions and the ones which are of interest to us are sym.imp.memcmp and sym.check:
# offset                     function
0x0000071a    4 97           sym.check
0x000005f0    1 6            sym.imp.memcmp
After retrieving the values for both functions, the next step is spawning the binary using r2frida to calculate the memory addresses of these functions. To ensure that both the memcmp and the check function are called the binary has been spawned with the following argument:
r2 "frida:///tmp/a.out testtesttesttesttestt"
The next step is retrieving the base address of a.out which can be done by using the :dm command to list modules joint with ~ to filter out the results:
[0x00000000]> :dm~out
0x000055c05fc86000 - 0x000055c05fc87000 r-x /tmp/a.out
0x000055c05fe86000 - 0x000055c05fe87000 r-- /tmp/a.out
0x000055c05fe87000 - 0x000055c05fe88000 rw- /tmp/a.out
In this situation, the base address for the spawned process is 0x000055c05fc86000 which can be used to add the offsets of each function and get their real address. For example, for sym.check:
[0x55c05fc8671a]> 0x000055c05fc86000 + 0x0000071a
0x55c05fc8671a is the address of the sym.check function, the next step is to trace it:
[0x55c05fc8671a]> :dtf 0x55c05fc8671a z^
true
With z the value is read as a UTF8 string. The next function to instrument is memcmp:
[0x55c05fc8671a]> 0x000055c05fc86000 + 0x000005f0
[0x55c05fc865f0]>
[0x55c05fc865f0]> :dtf 0x55c05fc865f0 hh
true
Since memcmp receives two const void* parameters the tracing format that we are using here is hh to hexdump the address of both arguments. Now that both functions have been traced the execution of the process can be resumed by calling :dc:
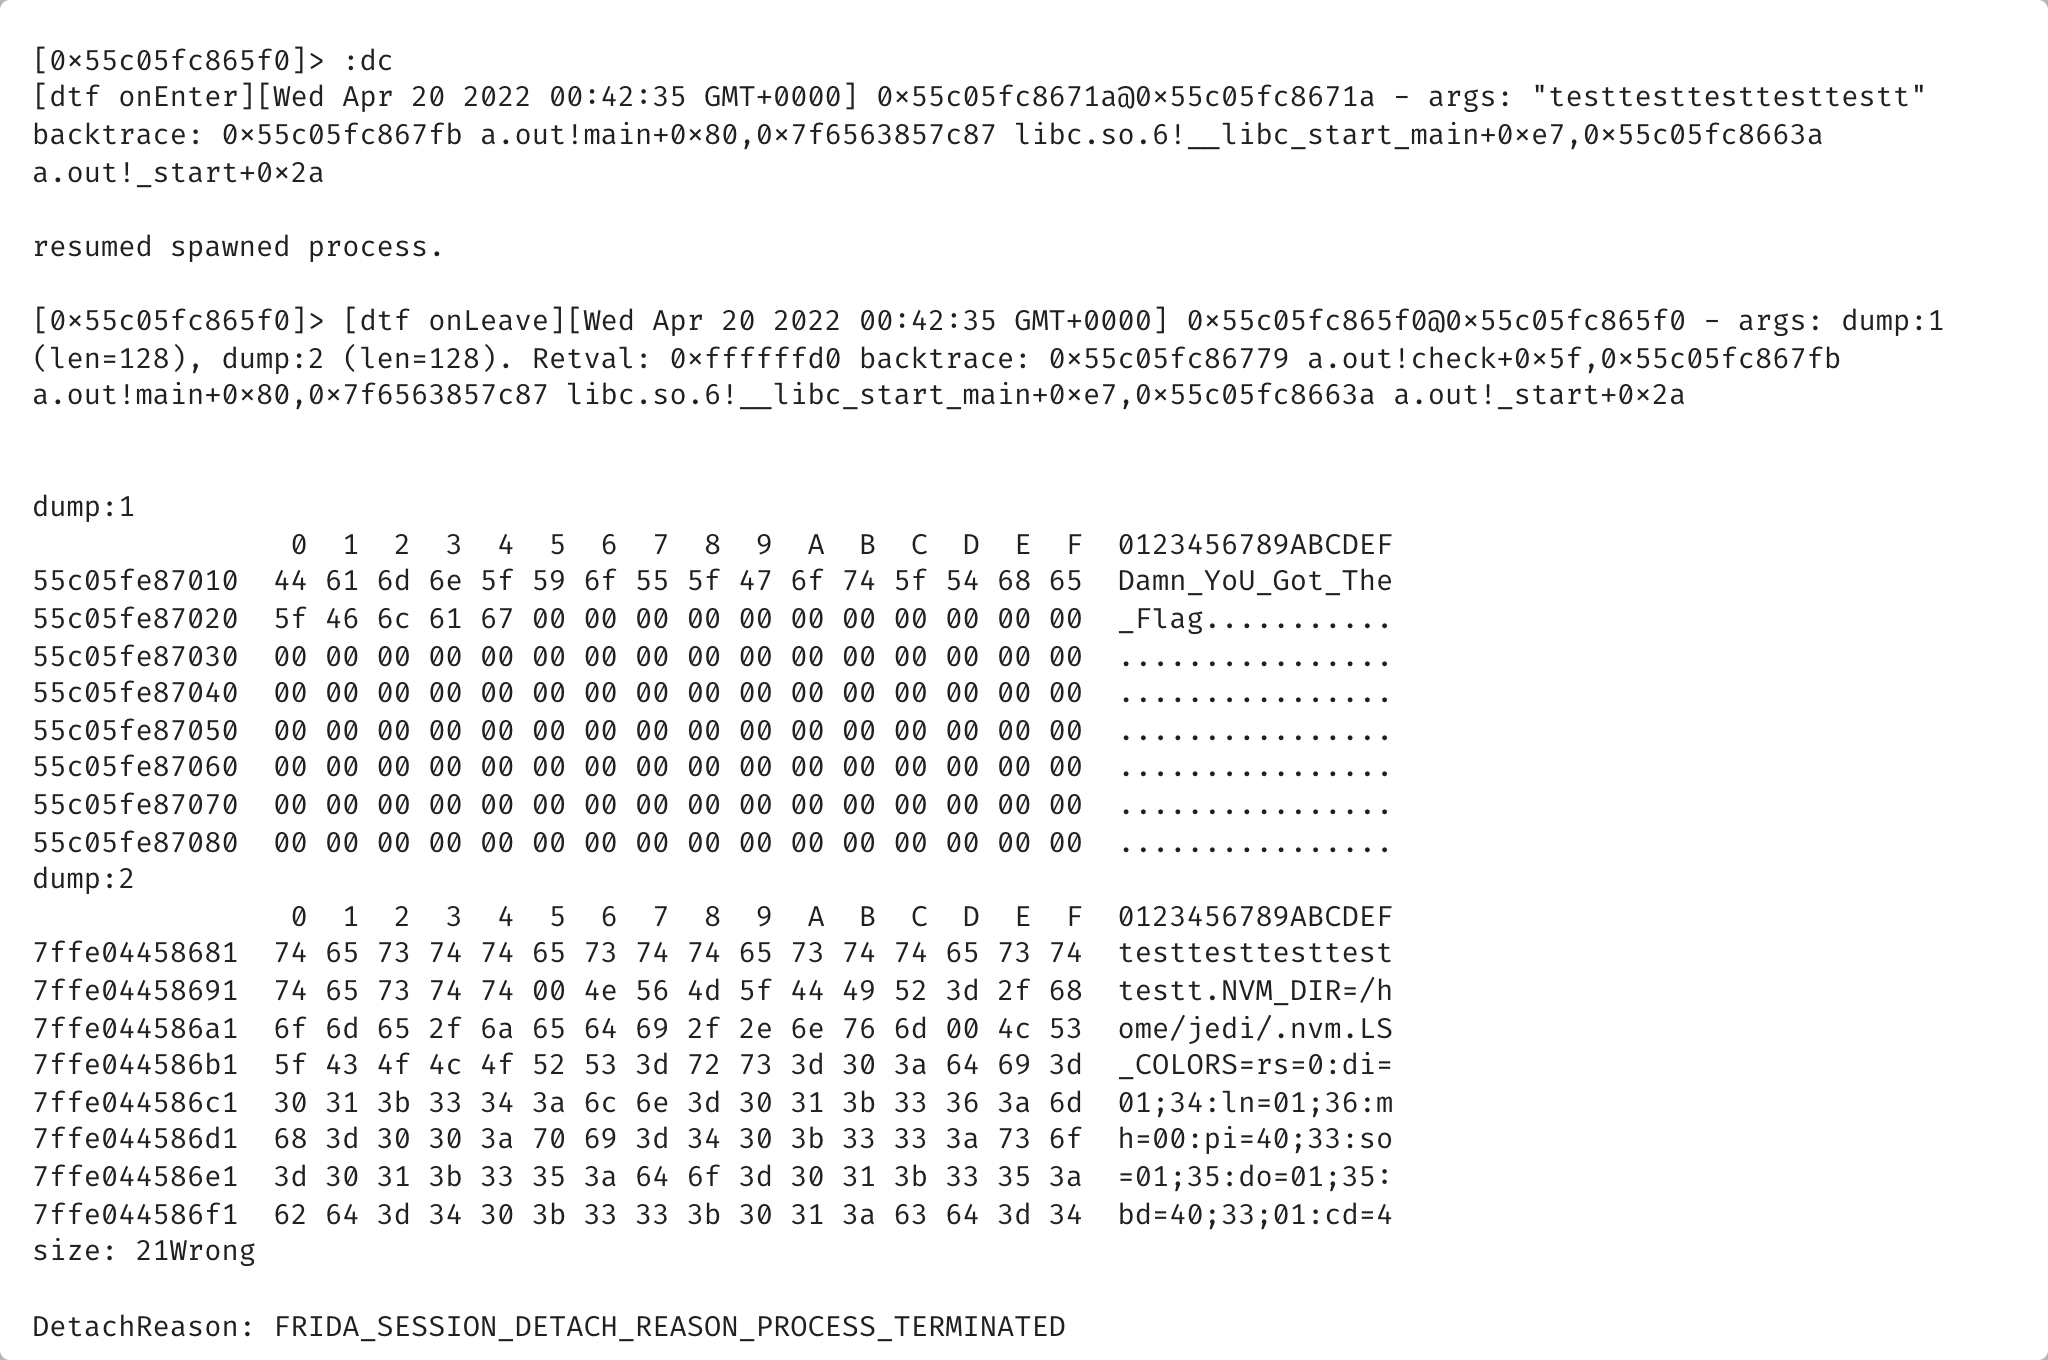
When the execution is resumed, the argument we passed to the check function "testtesttesttesttestt" can be read when the function is traced. The hexdumps for both arguments are also printed and from there the flag can be obtained.
Disassembling functions in memory
With r2frida it is possible to analyze and disassemble functions in memory provided the right addresses, something that is very powerful to inspect what functions do to extract valuable information from them. To learn to do this, we are going to use the previous code with the known offsets of the sym.check function and the memcmp function.
Again, we open the binary the same way as before:
r2 "frida:///tmp/a.out testtesttesttesttestt"
And then set emu.str=true to view the strings obtained from emulation and place ourselves at the sym.check address:
[0x00000000]> e emu.str=true
[0x00000000]> :dm~out
0x000055bf4aefa000 - 0x000055bf4aefb000 r-x /tmp/a.out
0x000055bf4b0fa000 - 0x000055bf4b0fb000 r-- /tmp/a.out
0x000055bf4b0fb000 - 0x000055bf4b0fc000 rw- /tmp/a.out
[0x00000000]> 0x000055bf4aefa000 + 0x0000071a
[0x55bf4aefa71a]>
The next step is analyzing the function which is done by typing af @ address, in our case:
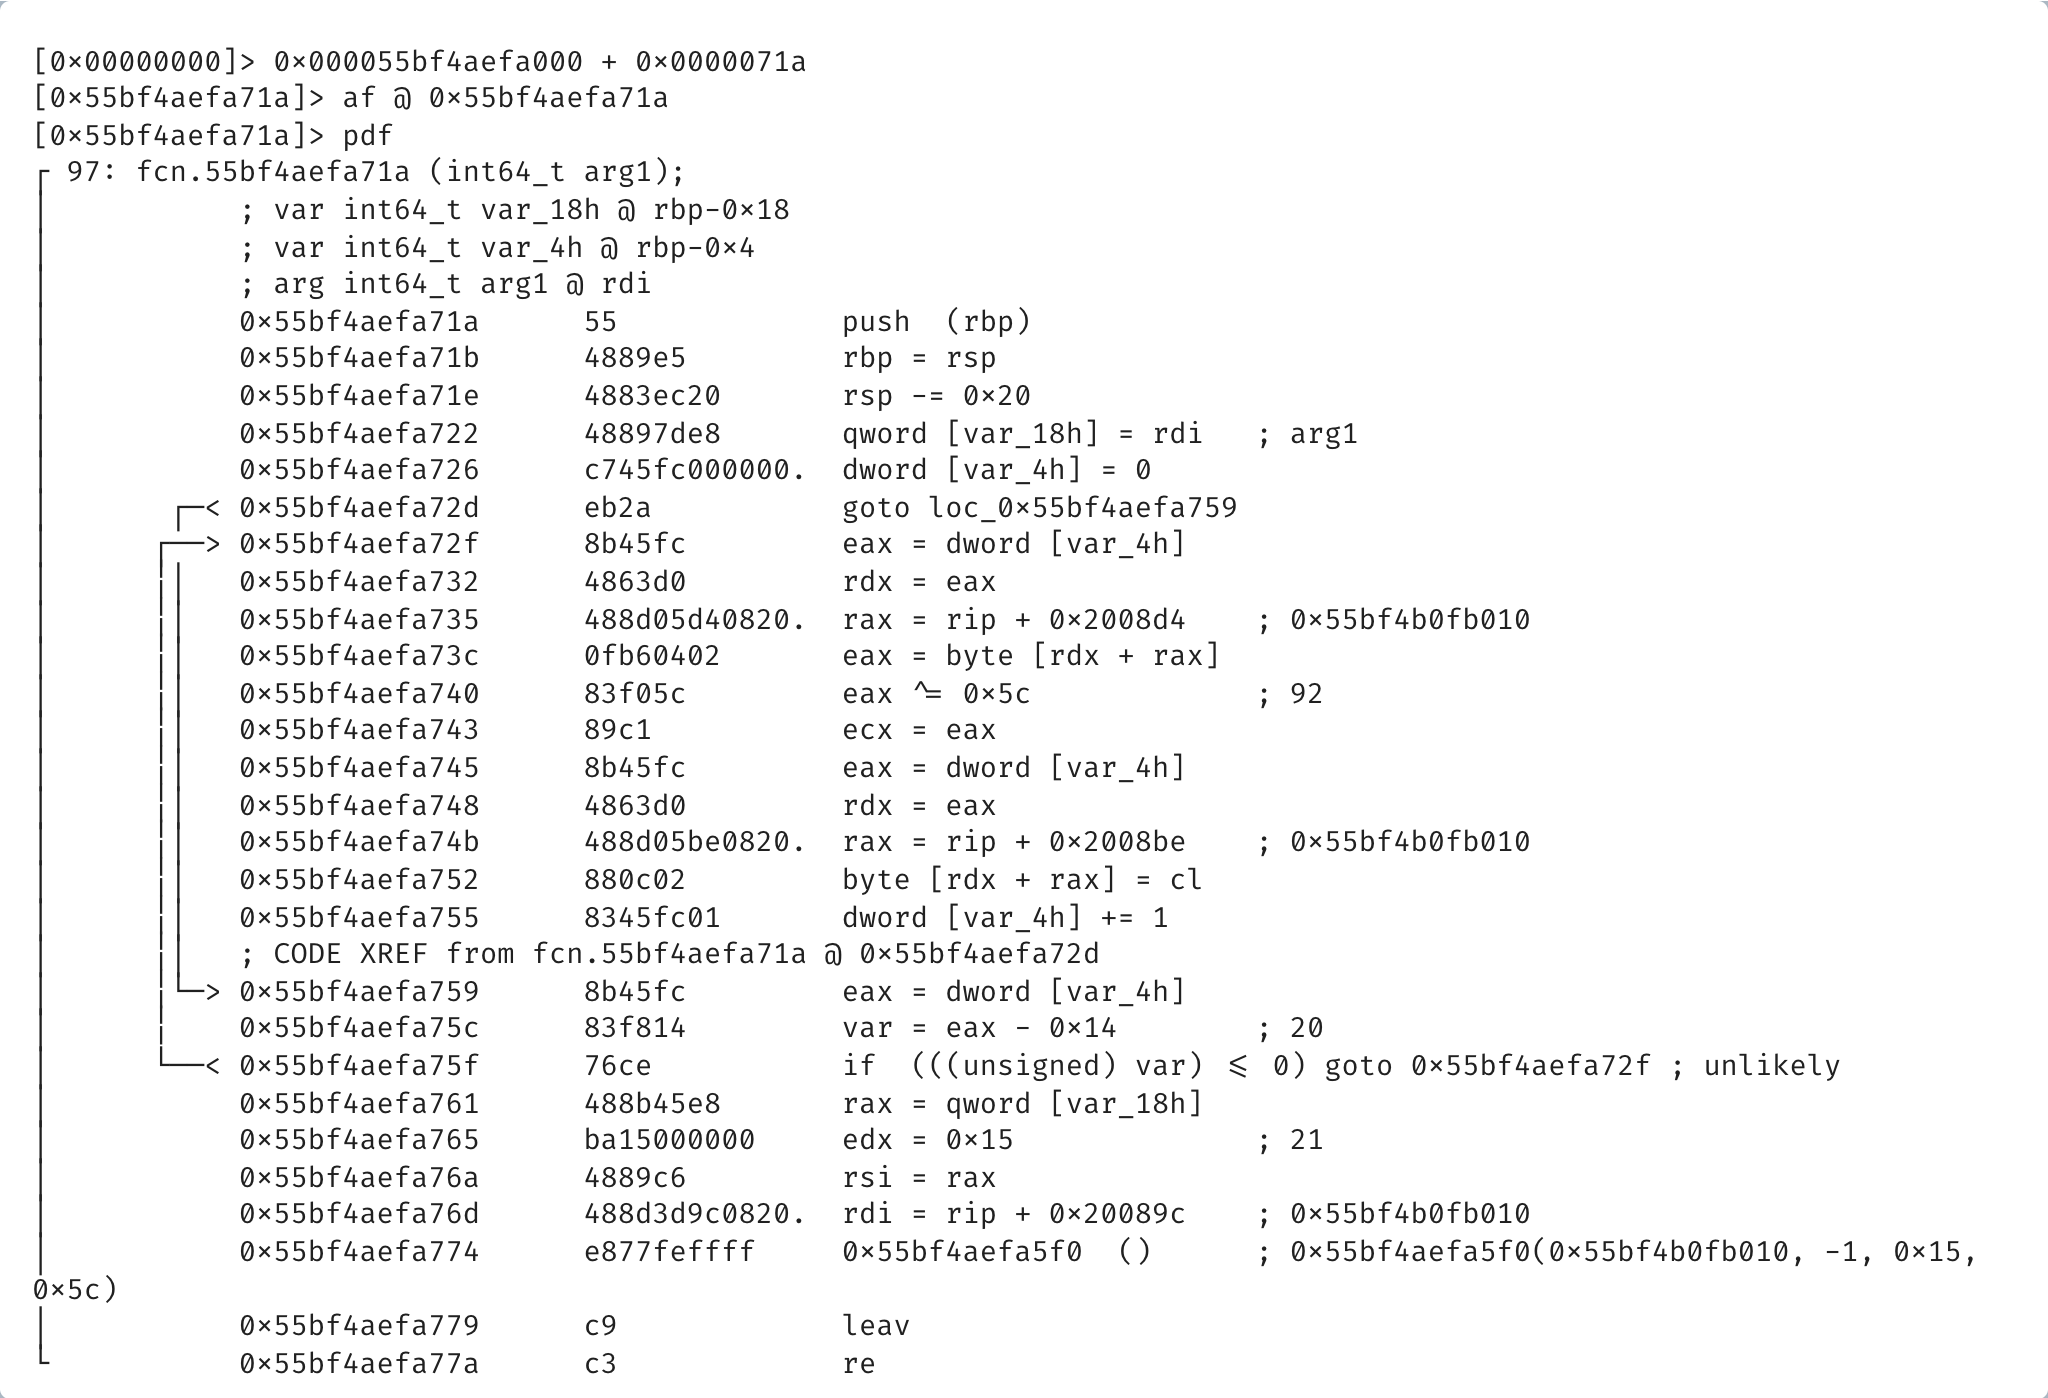
And with this , we have access to the disassembly of the function in memory and the addresses used by it.
Replacing return values (hijacking)
Intercepting and replacing (also known as hijacking) the return value of an address is possible using the :di command. The help of :di? shows:
[0x00000000]> :di?
 di intercept help
 di-1   intercept ret_1
 di0    intercept ret0
 di1    intercept ret1
 dif    intercept fun help
 dif-1  intercept fun ret_1
 dif0   intercept fun ret0
 dif1   intercept fun ret1
 difi   intercept fun ret int
 difs   intercept fun ret string
 dii    intercept ret int
 dis    intercept ret string
 div    intercept ret void
What this means is that :di-1 will replace the return value of the address with -1, :di0 will make the return value 0 and the same goes for :di1 which sets the return value to one. The same code as in the previous section is what we areusing to test this command out.
The idea is to patch the check function's return value so that it returns 0 allowing the code to return the string "You got it !!". The first thing to do to get the address of the check function:
[0x00000000]> 0x0000563b168e5000 + 0x0000071a
[0x563b168e571a]> :di0 0x563b168e571a
check function for this execution is 0x563b168e571a. The next step is to modify the return value by using the :di0 command:
[0x563b168e571a]> :di0 0x563b168e571a
And when checking the main function, the latest function called is 0x563b168e55c0 on which we are going to place a breakpoint by using the :db command to be able to see what happens:
│    │ │    0x563b168e5819      e8a2fdffff     0x563b168e55c0  ()
│    │ │    0x563b168e581e      b801000000     eax = 1
│    │ │    ; CODE XREFS from fcn.563b168e577b @ 0x563b168e57b0, 0x563b168e5810
│    └─└──> 0x563b168e5823      c9             leav
└           0x563b168e5824      c3             re
[0x563b168e577b]> :db 0x563b168e55c0
Now the execution can be resumed by using the :dc command:
[0x563b168e577b]> :dc
resumed spawned process.
[0x563b168e577b]> 0x563b168e55c0
0x563b168e580b a.out!main+0x90
    0x7f55ee0f6c87 libc.so.6!__libc_start_main+0xe7
    0x563b168e563a a.out!_start+0x2a
[0x563b168e577b]> # breakpoint was hit, resume execution again using :dc
[0x563b168e577b]> :dc
size: 21You got it !!
DetachReason: FRIDA_SESSION_DETACH_REASON_PROCESS_TERMINATED
We can see that although the process was spawned with the "testtesttesttesttestt" string instead of the correct flag it returned 0 and the code returns "You got it !!" in turn.
Allocating strings
A common use case is allocating strings on the heap, this can be done with the :dmas command. The :dmas command takes a string value and returns the address of the allocated string in the heap, for example:
[0x00000000]> :dmas r2fridarul3s
0x7f58d1436b60
The string r2fridarules is allocated at the address 0x7f58d1436b60. To keep track of the stuff that we have allocated throughout our session there command :dmal returns the list of our current allocations:
[0x00000000]> :dmal
0x7f58d1436b60  "r2fridarul3s"
Calling functions
It is possible to call functions of the process within r2frida by using the :dx command. The help for the :dx command is as follows:
[0x00000000]> :dx?
 dxc  dx call
 dxo  dx objc
 dxs  dx syscall
The :dx command is able to perform regular CALLs, Objective-C calls or syscalls. To test this feature out the following code example is used:
#include <stdio.h>

int main()
{
  FILE *fp = NULL;
  fp = fopen("sample_file.dat", "w");
  fclose(fp);
  return 0;
}
What we are going to do is to call the fopen function of this binary with a custom string, in order to do so the first step is opening it up in r2frida and the required strings for filename and mode respectively:
[0x00000000]> :dmas r2fridarul3s
0x7fd21c121cb0
[0x00000000]> :dmas w
0x7fd21e825e90
[0x00000000]> :dmal
0x7fd21c121cb0  "r2fridarul3s"
0x7fd21e825e90  "w"
Now that both strings have been allocated the next step is figuring out the address of the fopen function. This can be done as previously learned by getting the base address of the process:
[0x00000000]> :dm~out
0x000055c153ffa000 - 0x000055c153ffb000 r-x /home/jedi/fopentest/a.out
0x000055c1541fa000 - 0x000055c1541fb000 r-- /home/jedi/fopentest/a.out
0x000055c1541fb000 - 0x000055c1541fc000 rw- /home/jedi/fopentest/a.out
[0x00000000]> 0x000055c153ffa000 + 0x00000560
The result is that the address of the fopen function for this process is 0x55c153ffa560 which can now be used to call :dxc:
[0x55c153ffa560]> :dxc 0x55c153ffa560 0x7fd21c121cb0 0x7fd21e825e90
"0x7fd200000bc0"
The result 0x7fd200000bc0 is the address of the pointer to the FILE* returned by fopen. When inspecting our local folder the file is now present:
$ ls | grep r2
r2fridarul3s